Build an ATS-Friendly
Data Visualization Specialist Resume
That Gets Interviews
A Data Visualization Specialist transforms complex datasets into clear, compelling visuals that inform strategic decision-making. This role emphasizes not only aesthetic presentation but also the underlying data integrity and narrative. By collaborating closely with stakeholders, a specialist ensures that visual…
Data Visualization Specialist Resume Templates
Modern Professional
Use Template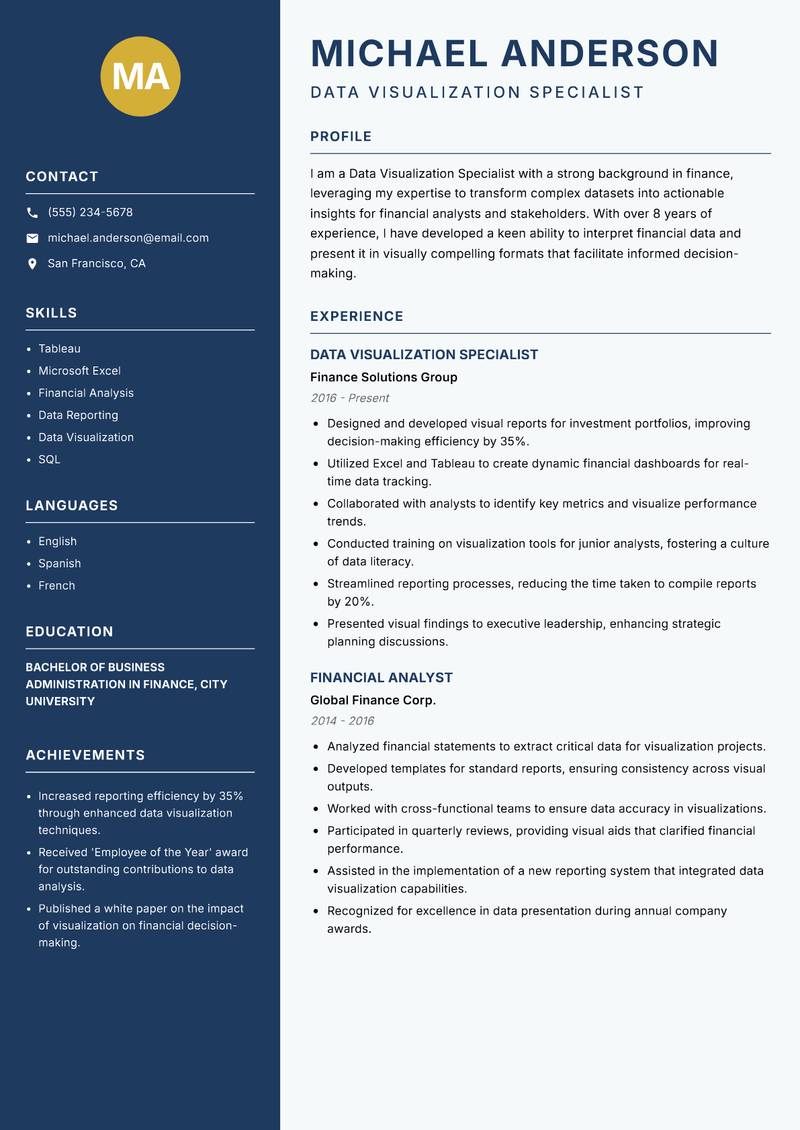
Classic Clean
Use Template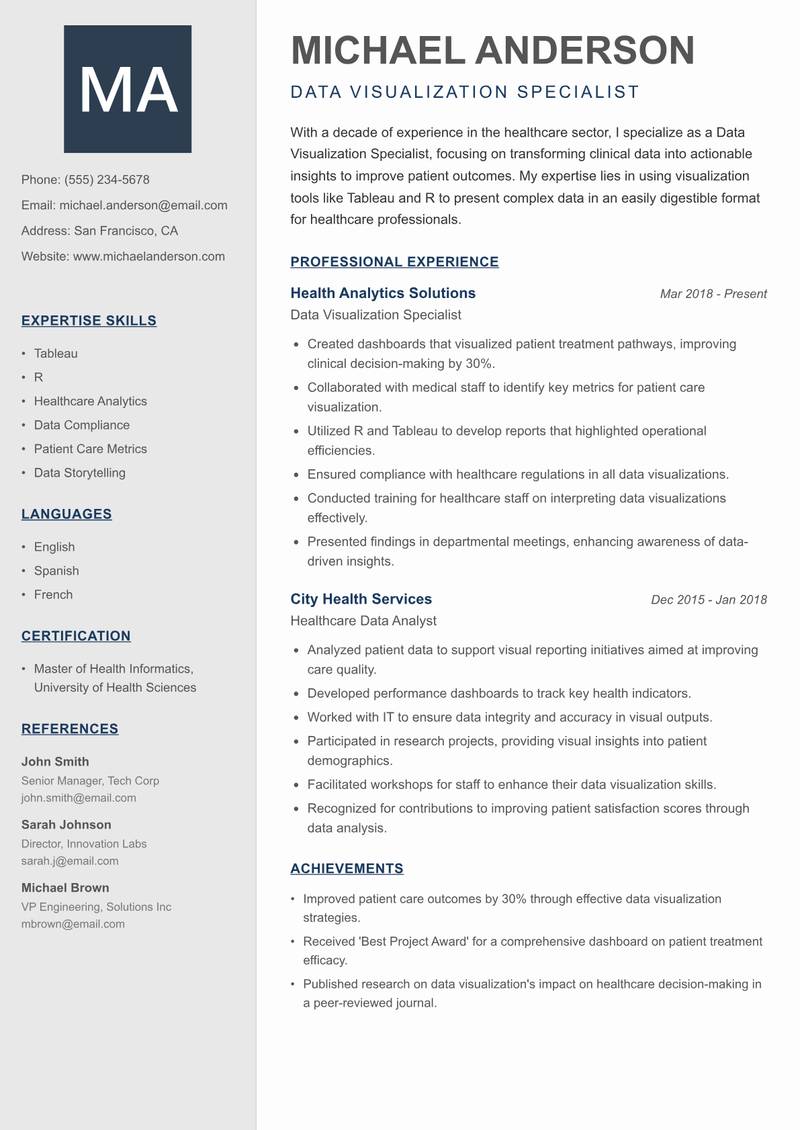
Creative Minimal
Use Template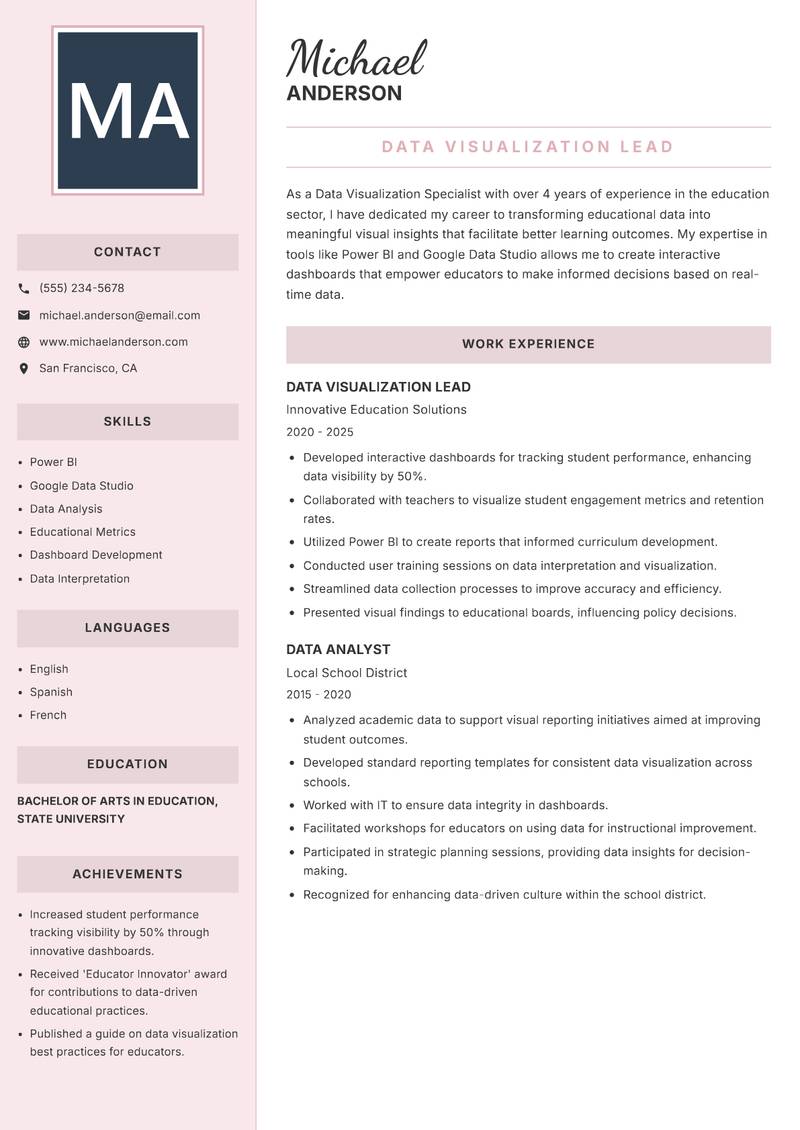
Executive
Use Template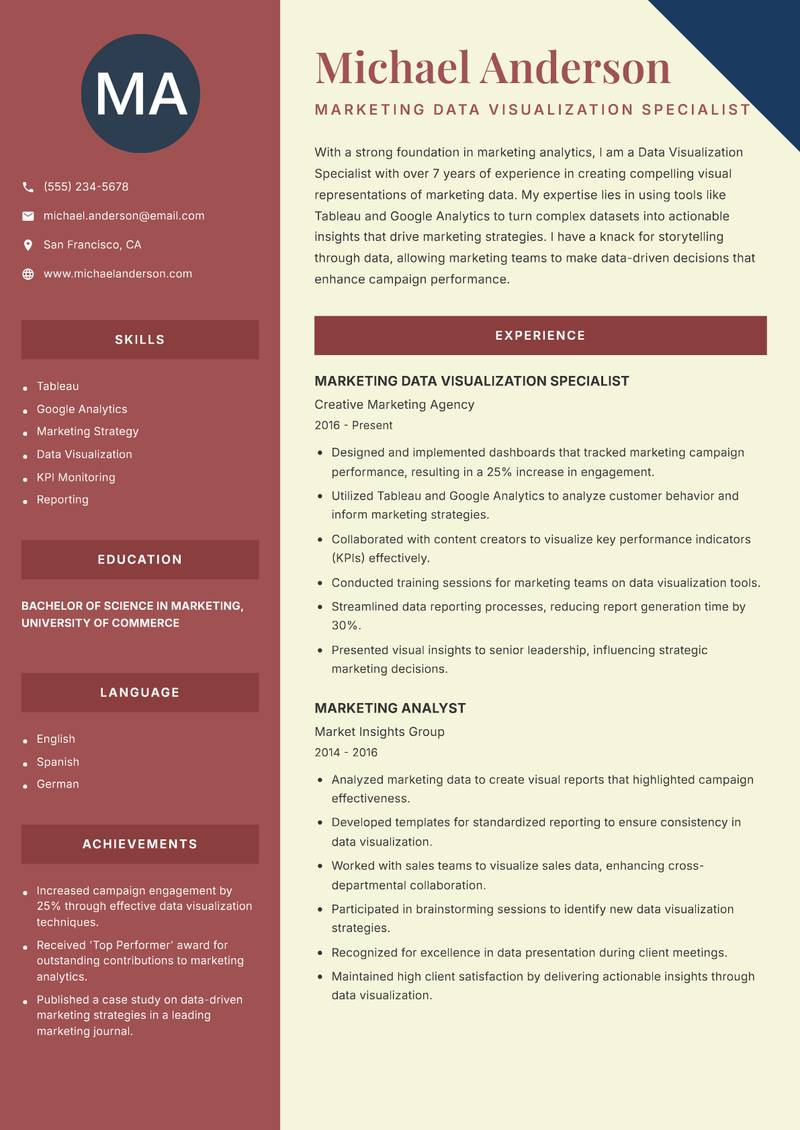
Two Column
Use Template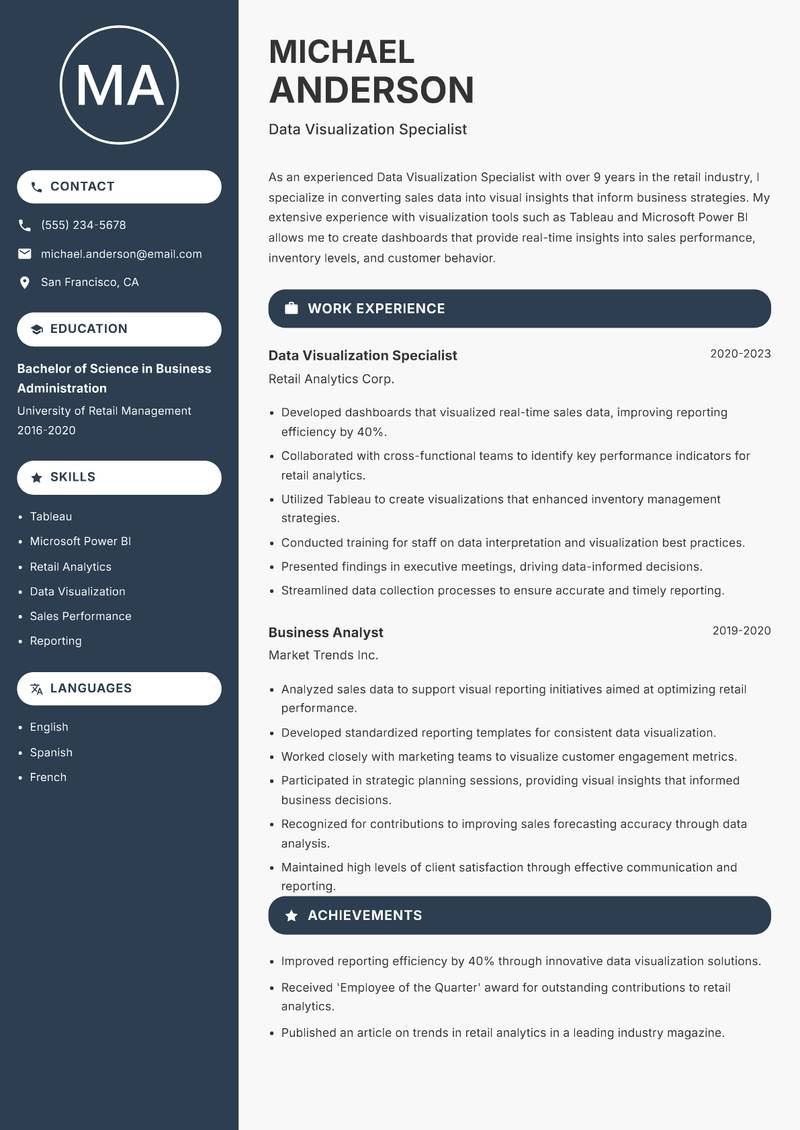
Compact
Use Template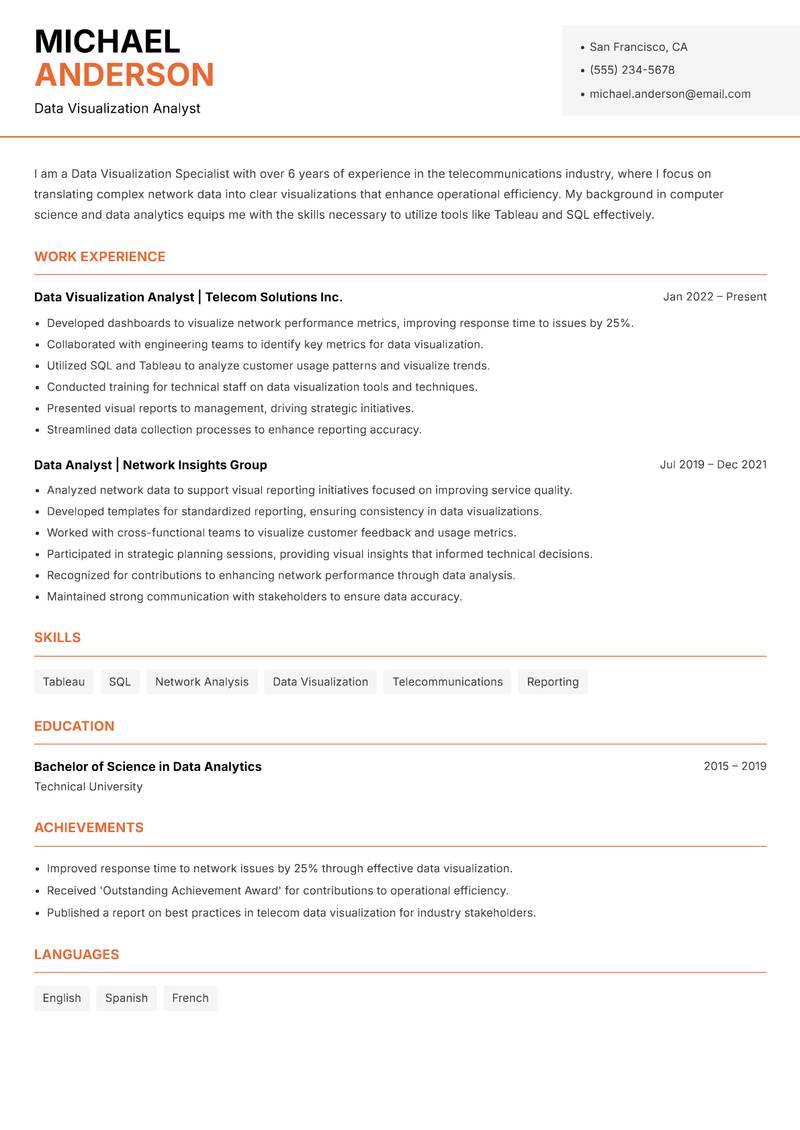
Modern Professional
Use Template7 Real Data Visualization Specialist Resume Examples
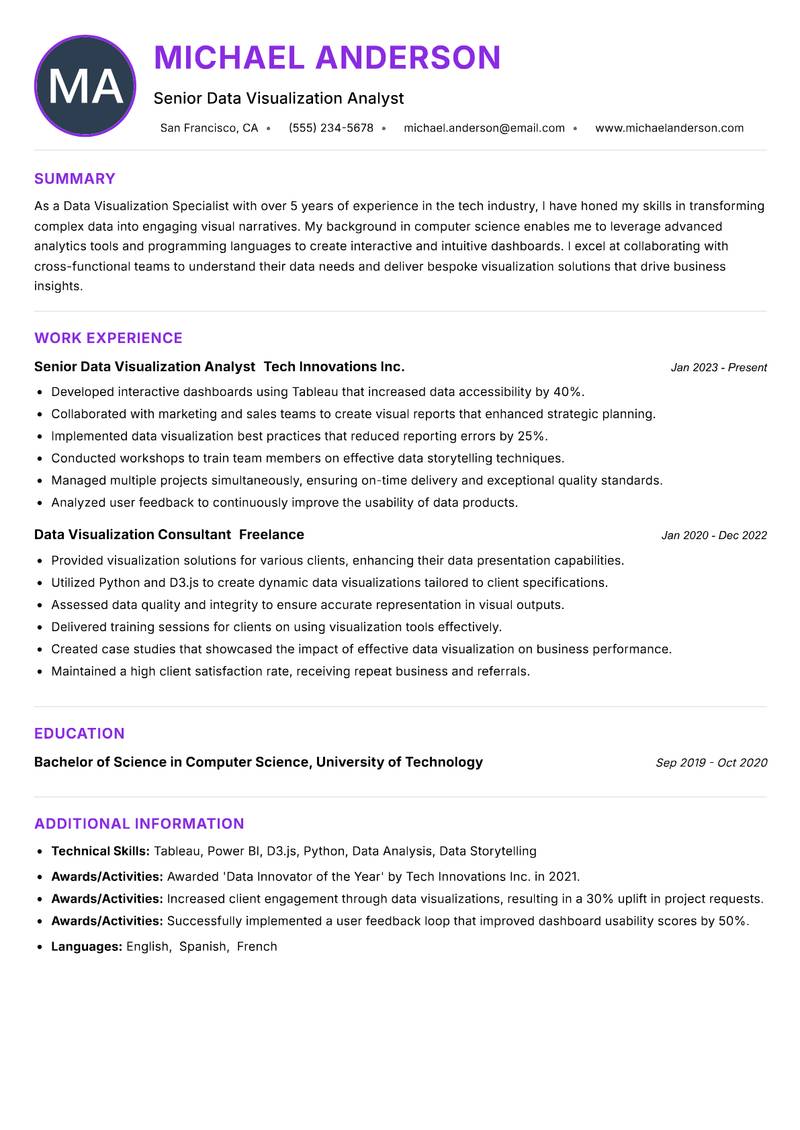
Senior Data Visualization Analyst with 7+ Years Experience
Summary: As a Data Visualization Specialist with over 5 years of experience in the tech industry, I have honed my skills in transforming complex data into engaging visual narratives. My background in computer science enables me to leverage advanced analytics tools and programming languages to create interactive and intuitive dashboards. I excel at collaborating with cross-functional teams to understand their data needs and deliver bespoke visualization solutions that drive business insights. My proficiency in tools like Tableau and Power BI, combined with my strong analytical mindset, allows me to present data in a way that is accessible and actionable for stakeholders at all levels. I am passionate about utilizing data storytelling to enhance decision-making processes and improve organizational outcomes. My commitment to continuous learning keeps me updated with the latest trends in data visualization, ensuring that my work remains innovative and impactful in a rapidly evolving field.
Description:
- Developed interactive dashboards using Tableau that increased data accessibility by 40%.
- Collaborated with marketing and sales teams to create visual reports that enhanced strategic planning.
- Implemented data visualization best practices that reduced reporting errors by 25%.
- Conducted workshops to train team members on effective data storytelling techniques.
- Managed multiple projects simultaneously, ensuring on-time delivery and exceptional quality standards.
- Analyzed user feedback to continuously improve the usability of data products.
🏆 Key Achievements
Data Visualization Specialist with 8+ Years Experience
Summary: I am a Data Visualization Specialist with a strong background in finance, leveraging my expertise to transform complex datasets into actionable insights for financial analysts and stakeholders. With over 8 years of experience, I have developed a keen ability to interpret financial data and present it in visually compelling formats that facilitate informed decision-making. My proficiency in tools such as Microsoft Excel and Tableau, combined with my analytical skills, allows me to create reports that highlight trends, forecasts, and key performance indicators. I have worked closely with investment teams to develop dashboards that monitor portfolio performance and risk metrics. My goal is to use data visualization to enhance financial reporting processes, ensuring clarity and precision in all deliverables. I am committed to continuous improvement and actively seek out new methods to present data in innovative ways that align with industry standards.
Description:
- Designed and developed visual reports for investment portfolios, improving decision-making efficiency by 35%.
- Utilized Excel and Tableau to create dynamic financial dashboards for real-time data tracking.
- Collaborated with analysts to identify key metrics and visualize performance trends.
- Conducted training on visualization tools for junior analysts, fostering a culture of data literacy.
- Streamlined reporting processes, reducing the time taken to compile reports by 20%.
- Presented visual findings to executive leadership, enhancing strategic planning discussions.
🏆 Key Achievements
Data Visualization Specialist with 10+ Years Experience
Summary: With a decade of experience in the healthcare sector, I specialize as a Data Visualization Specialist, focusing on transforming clinical data into actionable insights to improve patient outcomes. My expertise lies in using visualization tools like Tableau and R to present complex data in an easily digestible format for healthcare professionals. I have collaborated with medical teams to develop dashboards that track patient metrics, treatment efficacy, and operational performance. My role involves not only technical skills but also a deep understanding of healthcare regulations and data privacy, ensuring compliance while maximizing the utility of data visualization. I am passionate about bridging the gap between data and clinical practice, enabling healthcare providers to make informed decisions that enhance patient care. My continuous pursuit of knowledge in healthcare analytics drives my commitment to delivering high-quality visualizations that meet the unique needs of the industry.
Description:
- Created dashboards that visualized patient treatment pathways, improving clinical decision-making by 30%.
- Collaborated with medical staff to identify key metrics for patient care visualization.
- Utilized R and Tableau to develop reports that highlighted operational efficiencies.
- Ensured compliance with healthcare regulations in all data visualizations.
- Conducted training for healthcare staff on interpreting data visualizations effectively.
- Presented findings in departmental meetings, enhancing awareness of data-driven insights.
🏆 Key Achievements
Data Visualization Lead with 6+ Years Experience
Summary: As a Data Visualization Specialist with over 4 years of experience in the education sector, I have dedicated my career to transforming educational data into meaningful visual insights that facilitate better learning outcomes. My expertise in tools like Power BI and Google Data Studio allows me to create interactive dashboards that empower educators to make informed decisions based on real-time data. I work closely with school administrators and teachers to understand their data needs and develop visualizations that highlight student performance, engagement, and retention metrics. By focusing on data-driven strategies, I aim to support educational institutions in improving teaching methodologies and student success rates. My passion for education drives my commitment to delivering high-quality visualizations that make a tangible difference in the learning environment.
Description:
- Developed interactive dashboards for tracking student performance, enhancing data visibility by 50%.
- Collaborated with teachers to visualize student engagement metrics and retention rates.
- Utilized Power BI to create reports that informed curriculum development.
- Conducted user training sessions on data interpretation and visualization.
- Streamlined data collection processes to improve accuracy and efficiency.
- Presented visual findings to educational boards, influencing policy decisions.
🏆 Key Achievements
Marketing Data Visualization Specialist with 7+ Years Experience
Summary: With a strong foundation in marketing analytics, I am a Data Visualization Specialist with over 7 years of experience in creating compelling visual representations of marketing data. My expertise lies in using tools like Tableau and Google Analytics to turn complex datasets into actionable insights that drive marketing strategies. I have a knack for storytelling through data, allowing marketing teams to make data-driven decisions that enhance campaign performance. Throughout my career, I have collaborated with cross-functional teams to develop dashboards that monitor key marketing metrics such as ROI, engagement rates, and conversion rates. My analytical mindset combined with creative visualization skills enables me to present data in a manner that resonates with diverse audiences. I am passionate about leveraging data visualization to optimize marketing efforts and improve overall business results.
Description:
- Designed and implemented dashboards that tracked marketing campaign performance, resulting in a 25% increase in engagement.
- Utilized Tableau and Google Analytics to analyze customer behavior and inform marketing strategies.
- Collaborated with content creators to visualize key performance indicators (KPIs) effectively.
- Conducted training sessions for marketing teams on data visualization tools.
- Streamlined data reporting processes, reducing report generation time by 30%.
- Presented visual insights to senior leadership, influencing strategic marketing decisions.
🏆 Key Achievements
Data Visualization Specialist with 9+ Years Experience
Summary: As an experienced Data Visualization Specialist with over 9 years in the retail industry, I specialize in converting sales data into visual insights that inform business strategies. My extensive experience with visualization tools such as Tableau and Microsoft Power BI allows me to create dashboards that provide real-time insights into sales performance, inventory levels, and customer behavior. I have a proven track record of working collaboratively with sales and marketing teams to develop data-driven strategies that enhance customer engagement and optimize inventory management. My analytical skills and attention to detail ensure that the visualizations I create are not only visually appealing but also accurate and relevant to business needs. I am passionate about using data to drive retail performance and have successfully implemented visualization projects that have resulted in significant increases in sales and customer satisfaction.
Description:
- Developed dashboards that visualized real-time sales data, improving reporting efficiency by 40%.
- Collaborated with cross-functional teams to identify key performance indicators for retail analytics.
- Utilized Tableau to create visualizations that enhanced inventory management strategies.
- Conducted training for staff on data interpretation and visualization best practices.
- Presented findings in executive meetings, driving data-informed decisions.
- Streamlined data collection processes to ensure accurate and timely reporting.
🏆 Key Achievements
Data Visualization Analyst with 6+ Years Experience
Summary: I am a Data Visualization Specialist with over 6 years of experience in the telecommunications industry, where I focus on translating complex network data into clear visualizations that enhance operational efficiency. My background in computer science and data analytics equips me with the skills necessary to utilize tools like Tableau and SQL effectively. I have successfully developed dashboards that help monitor network performance, customer usage patterns, and service quality metrics. By collaborating with engineering and technical teams, I ensure that the data visualizations I create are relevant and actionable. I am dedicated to improving service delivery through data-driven insights and am always exploring new ways to present data that can lead to better decision-making and enhanced customer satisfaction. My goal is to leverage data visualization to support strategic initiatives within the telecommunications sector.
Description:
- Developed dashboards to visualize network performance metrics, improving response time to issues by 25%.
- Collaborated with engineering teams to identify key metrics for data visualization.
- Utilized SQL and Tableau to analyze customer usage patterns and visualize trends.
- Conducted training for technical staff on data visualization tools and techniques.
- Presented visual reports to management, driving strategic initiatives.
- Streamlined data collection processes to enhance reporting accuracy.
🏆 Key Achievements
Key Skills for Data Visualization Specialist
ATS Optimization Tips
Increase your chances of getting hired
Use Standard Headings
Use common section titles like Experience, Skills, etc.
Include Keywords
Add role-specific keywords from the job description
Keep it Simple
Avoid complex tables, images and graphics
Save in Right Format
Use PDF format unless otherwise specified
Data Visualization Specialist Salary Insights
Average Salary
$87,500
per year
Salary Range
$65,000 - $110,000
per year
Top Paying Cities
Los Angeles, Seattle, Houston, Dallas, Boston
Source: Glassdoor, Payscale, Indeed (Updated May 2025)
Everything you need to write a great Data Visualization Specialist resume
Strong Action Verbs to Use
Resume Writing Tips
- →Highlight specific projects showcasing your visualizations and the impact they had on decision-making.
- →Include metrics that demonstrate the effectiveness of your visual designs, such as increased engagement or reduced reporting time.
- →Mention collaboration cross-functionally with departments like marketing and finance to illustrate versatility.
- →Use action verbs specific to visualization work, such as 'designed,' 'implemented,' and 'optimized.'
- →Showcase relevant technical skills balanced with an understanding of business needs.
Common Mistakes to Avoid
- ✕Not tailoring your resume for the specific visualization tools you've used in each position, missing opportunities to highlight relevant experience.
- ✕Failing to include concrete results from your projects, making it difficult for employers to gauge your impact.
- ✕Overloading your resume with technical jargon without explaining their relevance or application.
- ✕Using a generic format that doesn’t visually demonstrate your design sense and expertise in visualization.
ATS Keywords for Data Visualization Specialist
Data Visualization Specialist Career Path
Relevant Certifications
Career Progression
Junior Data Visualization Analyst
Entry-level position focusing on data gathering and basic visualization tasks using tools like Tableau or Power BI.
Data Visualization Specialist
In this role, the emphasis is on creating complex data stories and interactive dashboards that facilitate decision-making across departments.
Senior Data Visualization Engineer
Leadership position responsible for overseeing project execution, mentoring junior team members, and defining visualization standards.
Data Analytics Manager
Manages a team of data analysts and visualization specialists, ensuring that data insights align with business goals.
Chief Data Officer
Executes the company’s data strategy on a corporate level, managing data governance, analytics, and visualization across all sectors.
Data Visualization Specialist Interview Questions
Can you describe your process for creating a data visualization from scratch? +
Discuss the steps you take from data collection to design and feedback.
What tools do you prefer for data visualization and why? +
Be specific about your experiences with tools like Tableau, Power BI, or others.
How do you handle receiving conflicting feedback on your visualizations? +
Share examples of resolution strategies that balance stakeholder needs.
Can you give an example of a complex dataset you visualized? What challenges did you face? +
Focus on specific technicalities and how you overcame obstacles.
How do you stay current with visualization best practices? +
Mention relevant courses, webinars, or professional groups you participate in.
Describe a time when your visualization influenced a business decision. What was the outcome? +
Quantify the impact whenever possible.
What methodological frameworks do you use for data storytelling? +
Explain how you structure narratives around data to enhance understanding.
About the Data Visualization Specialist Role
A Data Visualization Specialist transforms complex datasets into clear, compelling visuals that inform strategic decision-making. This role emphasizes not only aesthetic presentation but also the underlying data integrity and narrative. By collaborating closely with stakeholders, a specialist ensures that visual outputs align with business goals, enhancing user engagement and insight discovery.
Frequently Asked Questions
What makes a good data visualization? +
A good data visualization clearly conveys information and insights, is visually appealing, and is designed with the audience's needs in mind.
Do I need coding skills to be a Data Visualization Specialist? +
While it's not mandatory, familiarity with programming languages like Python or R can enhance your ability to create advanced visualizations.
What is the difference between data visualization and data analysis? +
Data visualization focuses on presenting data in an accessible format, while data analysis involves the interpretation and extraction of insights from data.
How important is user feedback in data visualization? +
User feedback is crucial as it guides improvements, ensuring the visualization meets the needs of its intended audience.
What industries require Data Visualization Specialists? +
Data Visualization Specialists are needed across various sectors, including healthcare, finance, marketing, and government.
Can Data Visualization Specialists work remotely? +
Yes, many companies hire Data Visualization Specialists for remote positions, especially considering the digital shift in data management.
More Resume Examples You Might Like
Related Career Paths
Other roles candidates for Data Visualization Specialist positions often also consider.
Will this Data Visualization Specialist resume pass the ATS scan?
Upload it and get an instant AI-scored compatibility check with specific fixes.
Check My Resume →
Pair it with a matching cover letter
AI drafts a first version from your job title and strengths — edit it live, then download the PDF.
Write My Cover Letter →
Written by Nohaya Career Team
Reviewed by HR Professionals · Updated May 2025
Ready to Build Your Perfect Resume?
Choose from 1000+ professional templates and land your dream job.
Create My Resume Now