Build an ATS-Friendly
Data Visualization Engineer Resume
That Gets Interviews
A Data Visualization Engineer crafts immersive and interactive experiences from raw data, employing tactical use of visualization software to convey complex insights clearly. By collaborating closely with data analysts and stakeholders, they focus on identifying crucial metrics and developing visual frameworks that…
Data Visualization Engineer Resume Templates
Modern Professional
Use Template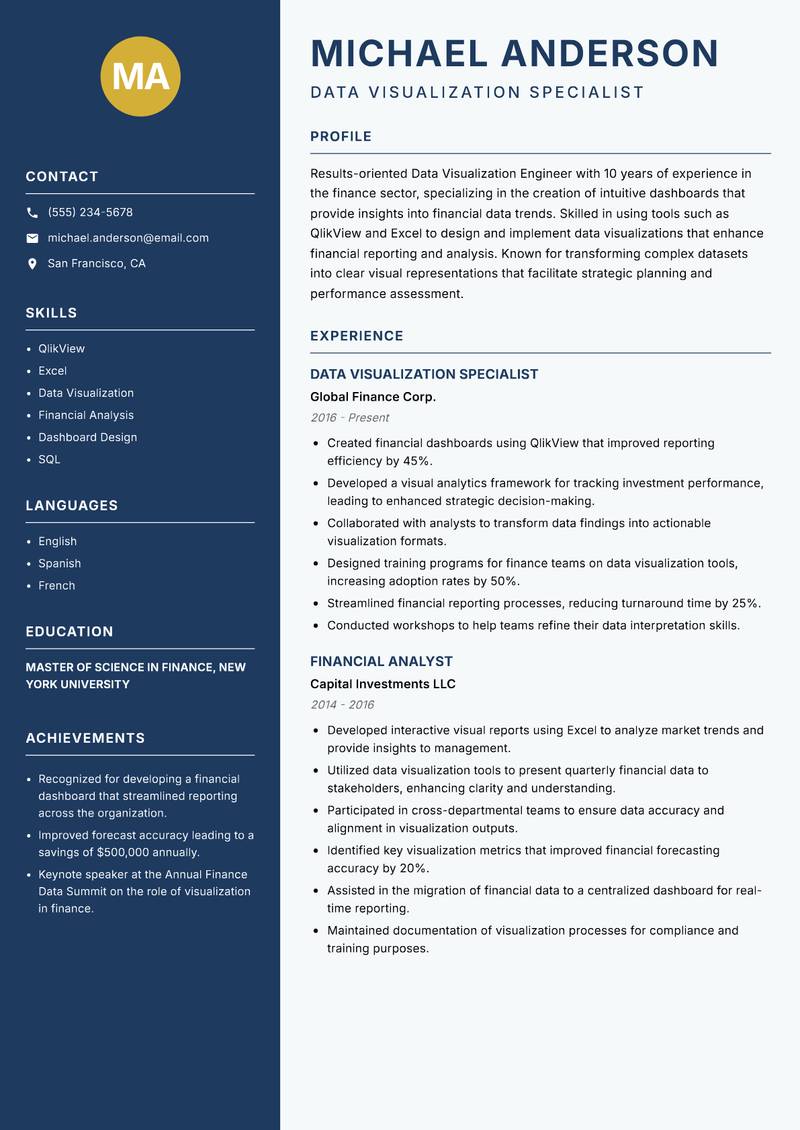
Classic Clean
Use Template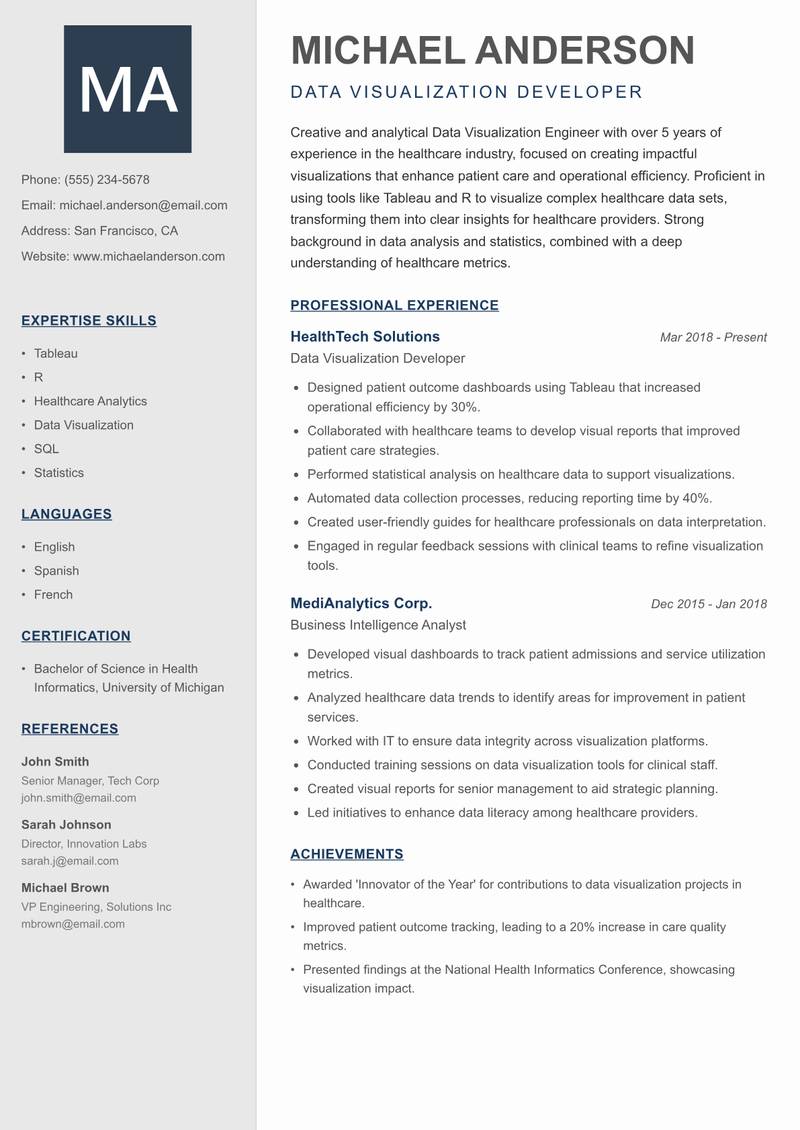
Creative Minimal
Use Template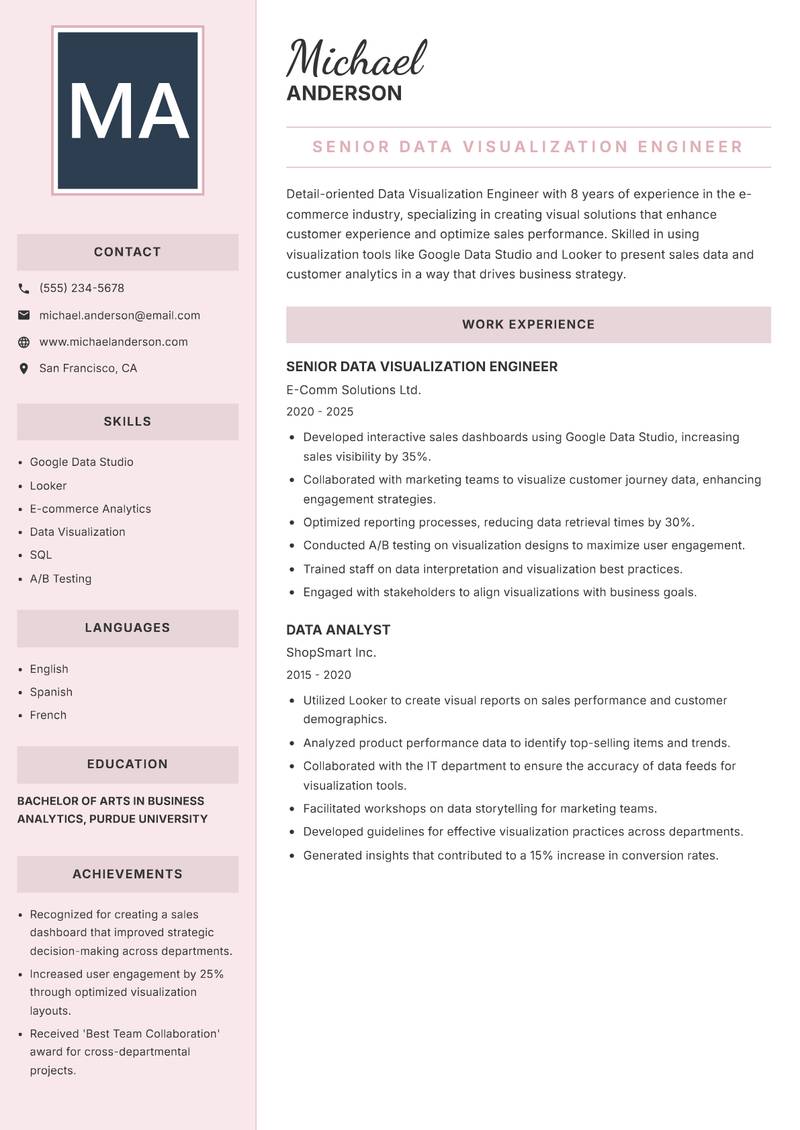
Executive
Use Template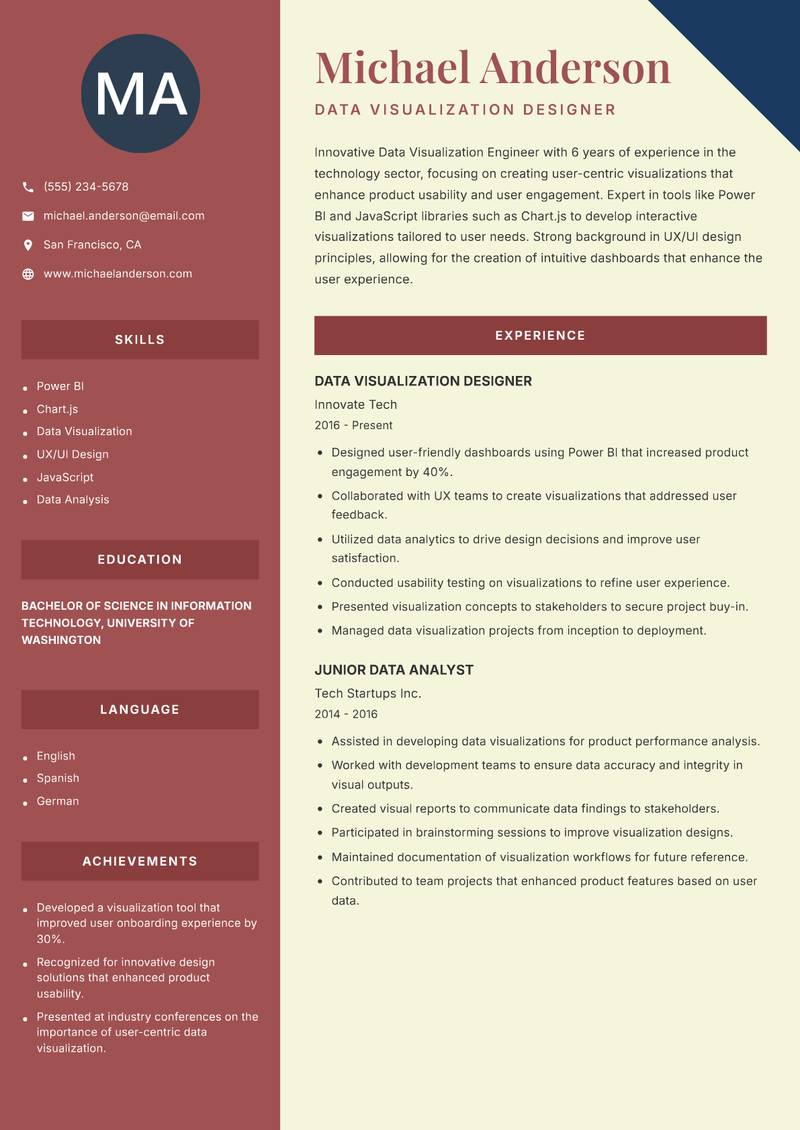
Two Column
Use Template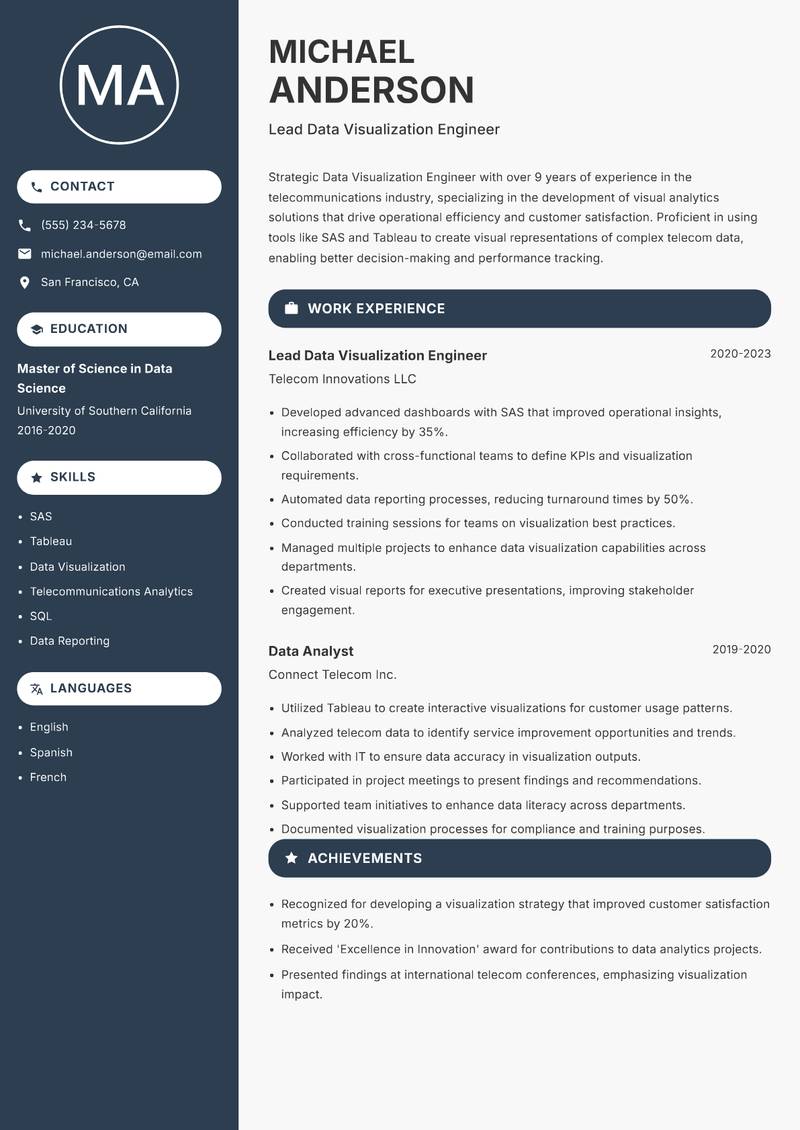
Compact
Use Template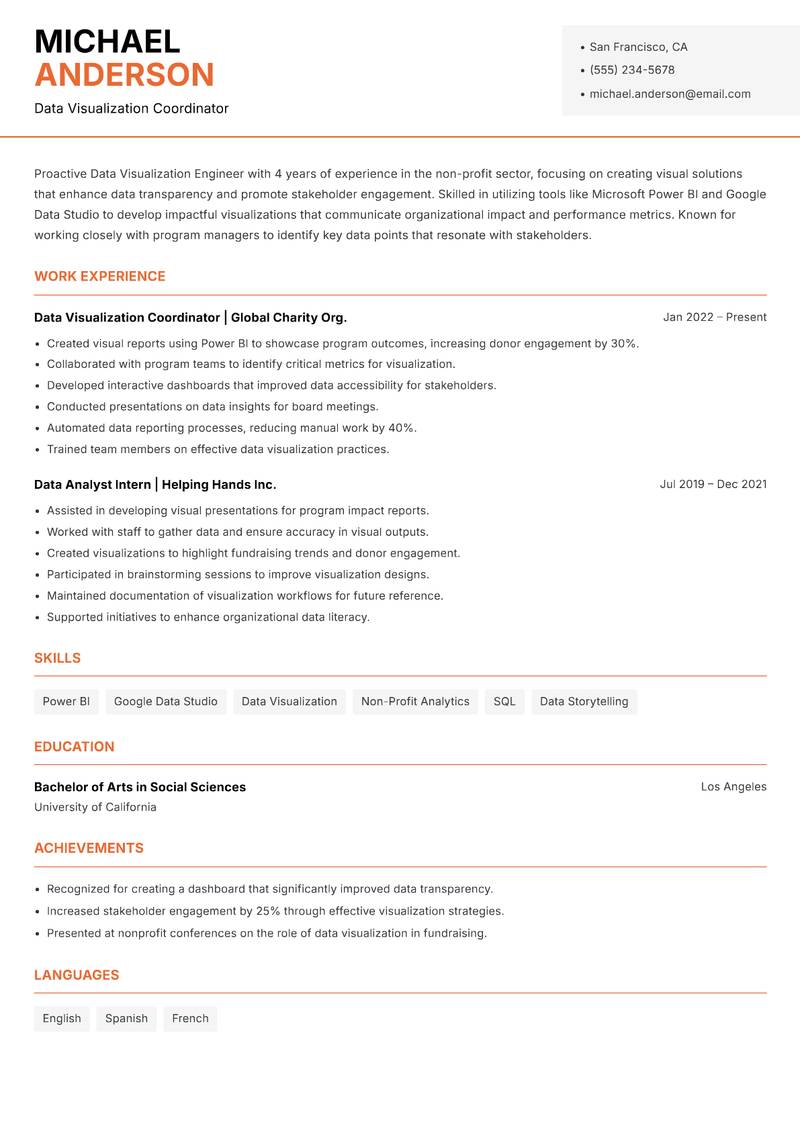
Modern Professional
Use Template7 Real Data Visualization Engineer Resume Examples
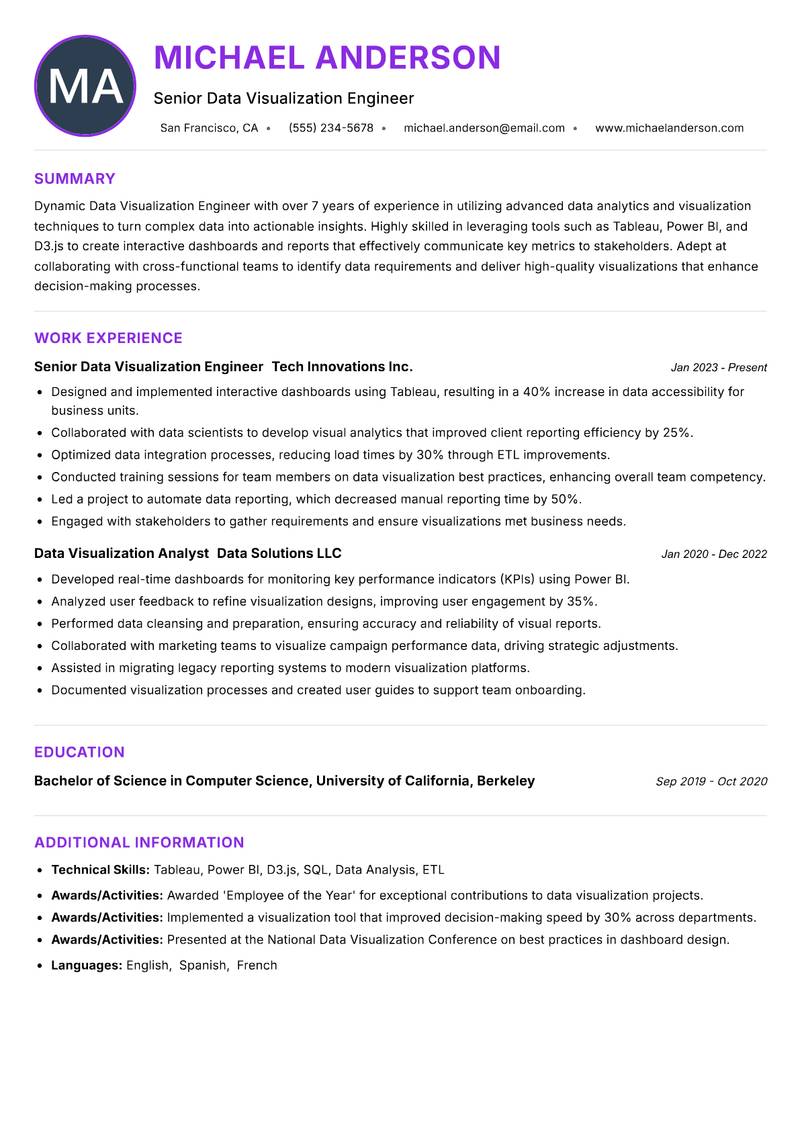
Senior Data Visualization Engineer with 7+ Years Experience
Summary: Dynamic Data Visualization Engineer with over 7 years of experience in utilizing advanced data analytics and visualization techniques to turn complex data into actionable insights. Highly skilled in leveraging tools such as Tableau, Power BI, and D3.js to create interactive dashboards and reports that effectively communicate key metrics to stakeholders. Adept at collaborating with cross-functional teams to identify data requirements and deliver high-quality visualizations that enhance decision-making processes. Proven ability to optimize existing data workflows and improve the accuracy of reporting systems. Passionate about using data storytelling to inform business strategies and drive organizational growth. Committed to continuous learning and staying updated with the latest industry trends and technologies, ensuring that visualization solutions are both innovative and effective.
Description:
- Designed and implemented interactive dashboards using Tableau, resulting in a 40% increase in data accessibility for business units.
- Collaborated with data scientists to develop visual analytics that improved client reporting efficiency by 25%.
- Optimized data integration processes, reducing load times by 30% through ETL improvements.
- Conducted training sessions for team members on data visualization best practices, enhancing overall team competency.
- Led a project to automate data reporting, which decreased manual reporting time by 50%.
- Engaged with stakeholders to gather requirements and ensure visualizations met business needs.
🏆 Key Achievements
Data Visualization Specialist with 10+ Years Experience
Summary: Accomplished Data Visualization Engineer with 10 years of experience in the finance sector, specializing in the creation of intuitive dashboards that provide insights into financial data trends. Skilled in using tools such as QlikView and Excel to design and implement data visualizations that enhance financial reporting and analysis. Known for transforming complex datasets into clear visual representations that facilitate strategic planning and performance assessment. Strong analytical skills combined with the ability to communicate findings effectively to both technical and non-technical audiences. Adept at working in fast-paced environments where attention to detail and accuracy are critical. Passionate about leveraging data visualization to support financial decision-making and improve operational efficiency.
Description:
- Created financial dashboards using QlikView that improved reporting efficiency by 45%.
- Developed a visual analytics framework for tracking investment performance, leading to enhanced strategic decision-making.
- Collaborated with analysts to transform data findings into actionable visualization formats.
- Designed training programs for finance teams on data visualization tools, increasing adoption rates by 50%.
- Streamlined financial reporting processes, reducing turnaround time by 25%.
- Conducted workshops to help teams refine their data interpretation skills.
🏆 Key Achievements
Data Visualization Developer with 5+ Years Experience
Summary: Creative and analytical Data Visualization Engineer with over 5 years of experience in the healthcare industry, focused on creating impactful visualizations that enhance patient care and operational efficiency. Proficient in using tools like Tableau and R to visualize complex healthcare data sets, transforming them into clear insights for healthcare providers. Strong background in data analysis and statistics, combined with a deep understanding of healthcare metrics. Known for collaborating with clinical teams to develop dashboards that monitor patient outcomes and improve service delivery. Committed to advancing healthcare through data-driven decision-making and innovative visualization solutions. Eager to contribute to initiatives aimed at improving healthcare quality and accessibility.
Description:
- Designed patient outcome dashboards using Tableau that increased operational efficiency by 30%.
- Collaborated with healthcare teams to develop visual reports that improved patient care strategies.
- Performed statistical analysis on healthcare data to support visualizations.
- Automated data collection processes, reducing reporting time by 40%.
- Created user-friendly guides for healthcare professionals on data interpretation.
- Engaged in regular feedback sessions with clinical teams to refine visualization tools.
🏆 Key Achievements
Senior Data Visualization Engineer with 8+ Years Experience
Summary: Detail-oriented Data Visualization Engineer with 8 years of experience in the e-commerce industry, specializing in creating visual solutions that enhance customer experience and optimize sales performance. Skilled in using visualization tools like Google Data Studio and Looker to present sales data and customer analytics in a way that drives business strategy. Known for leveraging data to identify trends, customer behavior, and market opportunities. Strong collaborator with marketing and sales teams to ensure that visual insights are aligned with business objectives. Passionate about utilizing data visualization to create engaging experiences that improve conversion rates and customer satisfaction. Committed to continuous improvement and innovation in the e-commerce space.
Description:
- Developed interactive sales dashboards using Google Data Studio, increasing sales visibility by 35%.
- Collaborated with marketing teams to visualize customer journey data, enhancing engagement strategies.
- Optimized reporting processes, reducing data retrieval times by 30%.
- Conducted A/B testing on visualization designs to maximize user engagement.
- Trained staff on data interpretation and visualization best practices.
- Engaged with stakeholders to align visualizations with business goals.
🏆 Key Achievements
Data Visualization Designer with 6+ Years Experience
Summary: Innovative Data Visualization Engineer with 6 years of experience in the technology sector, focusing on creating user-centric visualizations that enhance product usability and user engagement. Expert in tools like Power BI and JavaScript libraries such as Chart.js to develop interactive visualizations tailored to user needs. Strong background in UX/UI design principles, allowing for the creation of intuitive dashboards that enhance the user experience. Known for working closely with product teams to identify user pain points and effectively communicate insights through visual storytelling. Committed to leveraging data visualization to improve product design and user satisfaction in the tech industry.
Description:
- Designed user-friendly dashboards using Power BI that increased product engagement by 40%.
- Collaborated with UX teams to create visualizations that addressed user feedback.
- Utilized data analytics to drive design decisions and improve user satisfaction.
- Conducted usability testing on visualizations to refine user experience.
- Presented visualization concepts to stakeholders to secure project buy-in.
- Managed data visualization projects from inception to deployment.
🏆 Key Achievements
Lead Data Visualization Engineer with 9+ Years Experience
Summary: Strategic Data Visualization Engineer with over 9 years of experience in the telecommunications industry, specializing in the development of visual analytics solutions that drive operational efficiency and customer satisfaction. Proficient in using tools like SAS and Tableau to create visual representations of complex telecom data, enabling better decision-making and performance tracking. Known for collaborating with technical teams to ensure data quality and accuracy in visual outputs. Strong capabilities in translating technical data into meaningful visual insights for non-technical stakeholders. Committed to optimizing data processes and improving business outcomes through effective visualization strategies.
Description:
- Developed advanced dashboards with SAS that improved operational insights, increasing efficiency by 35%.
- Collaborated with cross-functional teams to define KPIs and visualization requirements.
- Automated data reporting processes, reducing turnaround times by 50%.
- Conducted training sessions for teams on visualization best practices.
- Managed multiple projects to enhance data visualization capabilities across departments.
- Created visual reports for executive presentations, improving stakeholder engagement.
🏆 Key Achievements
Data Visualization Coordinator with 4+ Years Experience
Summary: Driven Data Visualization Engineer with 4 years of experience in the non-profit sector, focusing on creating visual solutions that enhance data transparency and promote stakeholder engagement. Skilled in utilizing tools like Microsoft Power BI and Google Data Studio to develop impactful visualizations that communicate organizational impact and performance metrics. Known for working closely with program managers to identify key data points that resonate with stakeholders. Passionate about using data visualization to tell compelling stories that drive donor engagement and support fundraising initiatives. Committed to fostering a culture of data-driven decision-making within non-profit organizations.
Description:
- Created visual reports using Power BI to showcase program outcomes, increasing donor engagement by 30%.
- Collaborated with program teams to identify critical metrics for visualization.
- Developed interactive dashboards that improved data accessibility for stakeholders.
- Conducted presentations on data insights for board meetings.
- Automated data reporting processes, reducing manual work by 40%.
- Trained team members on effective data visualization practices.
🏆 Key Achievements
Key Skills for Data Visualization Engineer
ATS Optimization Tips
Increase your chances of getting hired
Use Standard Headings
Use common section titles like Experience, Skills, etc.
Include Keywords
Add role-specific keywords from the job description
Keep it Simple
Avoid complex tables, images and graphics
Save in Right Format
Use PDF format unless otherwise specified
Data Visualization Engineer Salary Insights
Average Salary
$107,500
per year
Salary Range
$85,000 - $130,000
per year
Top Paying Cities
Los Angeles, Seattle, Houston, Dallas, Boston
Source: Glassdoor, Payscale, Indeed (Updated May 2025)
Everything you need to write a great Data Visualization Engineer resume
Strong Action Verbs to Use
Resume Writing Tips
- →Highlight specific visualization tools you've mastered, such as Tableau or Power BI, with examples of dashboards you've created.
- →Detail collaborative projects where you engaged with business stakeholders, emphasizing communication skills and tailoring visualizations to audience needs.
- →Include metrics or KPIs impacted by your visualizations, demonstrating the value added to decision-making processes.
- →Showcase technical proficiency in data manipulation tools and programming languages relevant to visualization, like SQL or Python.
- →Get creative with your resume's layout; consider using visual elements to highlight your skills in design and visualization.
Common Mistakes to Avoid
- ✕Neglecting to tailor project examples to the job description, which can limit perceived relevance of skills.
- ✕Listing general skills without context; always aim to show how you've applied your skills in real scenarios.
- ✕Overloading the resume with technical jargon that may confuse non-technical hiring managers.
- ✕Failing to quantify achievements related to your visual projects, which can weaken the impact of your contributions.
ATS Keywords for Data Visualization Engineer
Data Visualization Engineer Career Path
Relevant Certifications
Career Progression
Junior Data Visualization Engineer
Entering the industry, responsible for assisting in the creation of basic visualizations and reporting tools.
Data Visualization Engineer
Independently designs and develops advanced visual analytics dashboards using tools like Tableau or Power BI.
Senior Data Visualization Engineer
Leads projects, collaborates with cross-functional teams, and mentors junior engineers in best practices.
Lead Data Visualization Engineer
Oversees a team of engineers and strategizes the adoption of new visualization techniques across the organization.
Principal Data Visualization Engineer
Sets the vision for data storytelling and visualization methodologies in alignment with company goals.
Data Visualization Engineer Interview Questions
Can you explain your process for designing a dashboard that meets stakeholder requirements? +
Consider discussing how you gather requirements, sketch out design ideas, and iterate based on feedback.
What visualization techniques do you prefer for different types of data sets and why? +
Highlight specific data types and appropriate visualization formats that maximize understanding.
How do you ensure data integrity and accuracy in your visualizations? +
Discuss strategies for validating data before visualization.
Can you describe a challenging project you worked on and the outcomes? +
Focus on the challenges faced, how you overcame them, and the impact of your work.
What experience do you have with programming languages in data visualization? +
Mention relevant programming tools such as Python or R and how you've utilized them.
How do you approach feedback from non-technical stakeholders? +
Provide examples of how you communicate complex data insights in layman’s terms.
About the Data Visualization Engineer Role
A Data Visualization Engineer crafts immersive and interactive experiences from raw data, employing tactical use of visualization software to convey complex insights clearly. By collaborating closely with data analysts and stakeholders, they focus on identifying crucial metrics and developing visual frameworks that guide business decisions. Their work typically includes the utilization of tools such as Tableau and D3.js for building intuitive dashboards that facilitate storytelling through data.
Frequently Asked Questions
What software should a Data Visualization Engineer be proficient in? +
Key software includes Tableau, Power BI, and D3.js, though proficiency in SQL and Python can enhance data manipulation capabilities.
Is prior experience necessary to become a Data Visualization Engineer? +
While some positions may require experience, many entry-level roles are available for those with strong analytical skills and relevant internships.
How important is UX/UI design knowledge in this role? +
Understanding user experience and interface design is critical to creating effective visualizations that resonate with users.
What types of industries hire Data Visualization Engineers? +
Industries like finance, healthcare, marketing, and technology frequently seek Data Visualization Engineers to analyze and present data.
Are certifications beneficial for Data Visualization Engineers? +
Certifications, especially in software like Tableau or data analytics, can enhance credibility and job prospects.
What is the career progression for a Data Visualization Engineer? +
Career paths often lead from junior roles to senior positions and eventually to lead or principal roles, with increasing responsibilities.
More Resume Examples You Might Like
Related Career Paths
Other roles candidates for Data Visualization Engineer positions often also consider.
Will this Data Visualization Engineer resume pass the ATS scan?
Upload it and get an instant AI-scored compatibility check with specific fixes.
Check My Resume →
Pair it with a matching cover letter
AI drafts a first version from your job title and strengths — edit it live, then download the PDF.
Write My Cover Letter →
Written by Nohaya Career Team
Reviewed by HR Professionals · Updated May 2025
Ready to Build Your Perfect Resume?
Choose from 1000+ professional templates and land your dream job.
Create My Resume Now